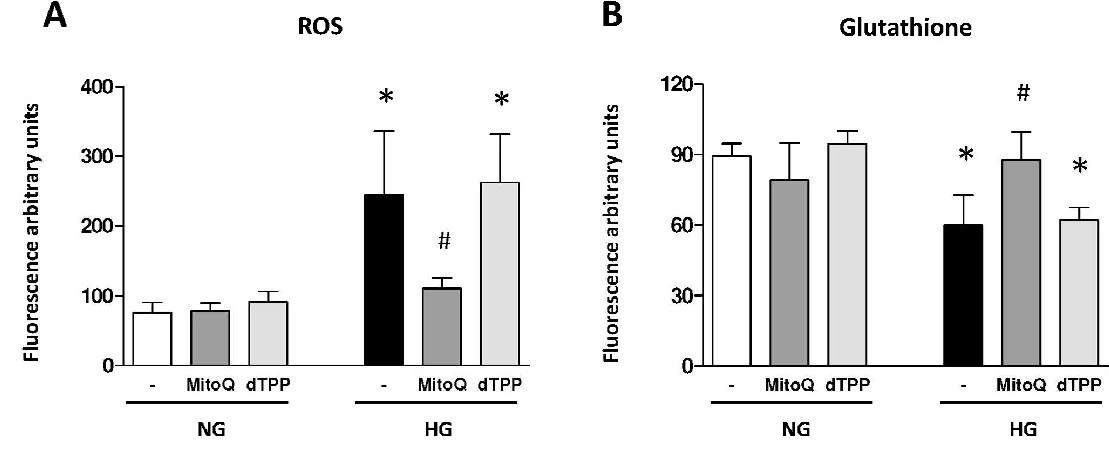
Fig. 3. Effects of MitoQ (3h, 0.5 µM) on oxidative stress parameters in pancreatic β cells under normoglycaemia and hyperglycaemia. (A) ROS production measured as DCFH-DA fluorescence by fluorometry. (B) GSH levels measured as CMFDA fluorescence by fluorometry. *p<0.05 with regard to control in normoglycaemia. #p<0.05 comparing groups treated and not treated with MitoQ in the hyperglycaemic condition (data represented as mean ± S.E.M, n=6).